A portfolio's volatility tells you about an average day. It says almost nothing about the day that actually hurts. For an equity-heavy book, the question a risk committee cares about isn't ‘how much does this bounce around’ — it's ‘how much could we lose on a genuinely bad day, and how much should we trust that number?’ This project pins down the worst-case day three different ways and shows exactly where the comfortable answer is wrong.
Five years of daily adjusted-close prices for an 8-asset portfolio, pulled from Yahoo Finance via yfinance — roughly 2019 through 2024, deliberately chosen to span the COVID crash and the 2022 rate-hike bear market so the tail estimates are built on real stress rather than a calm sample.
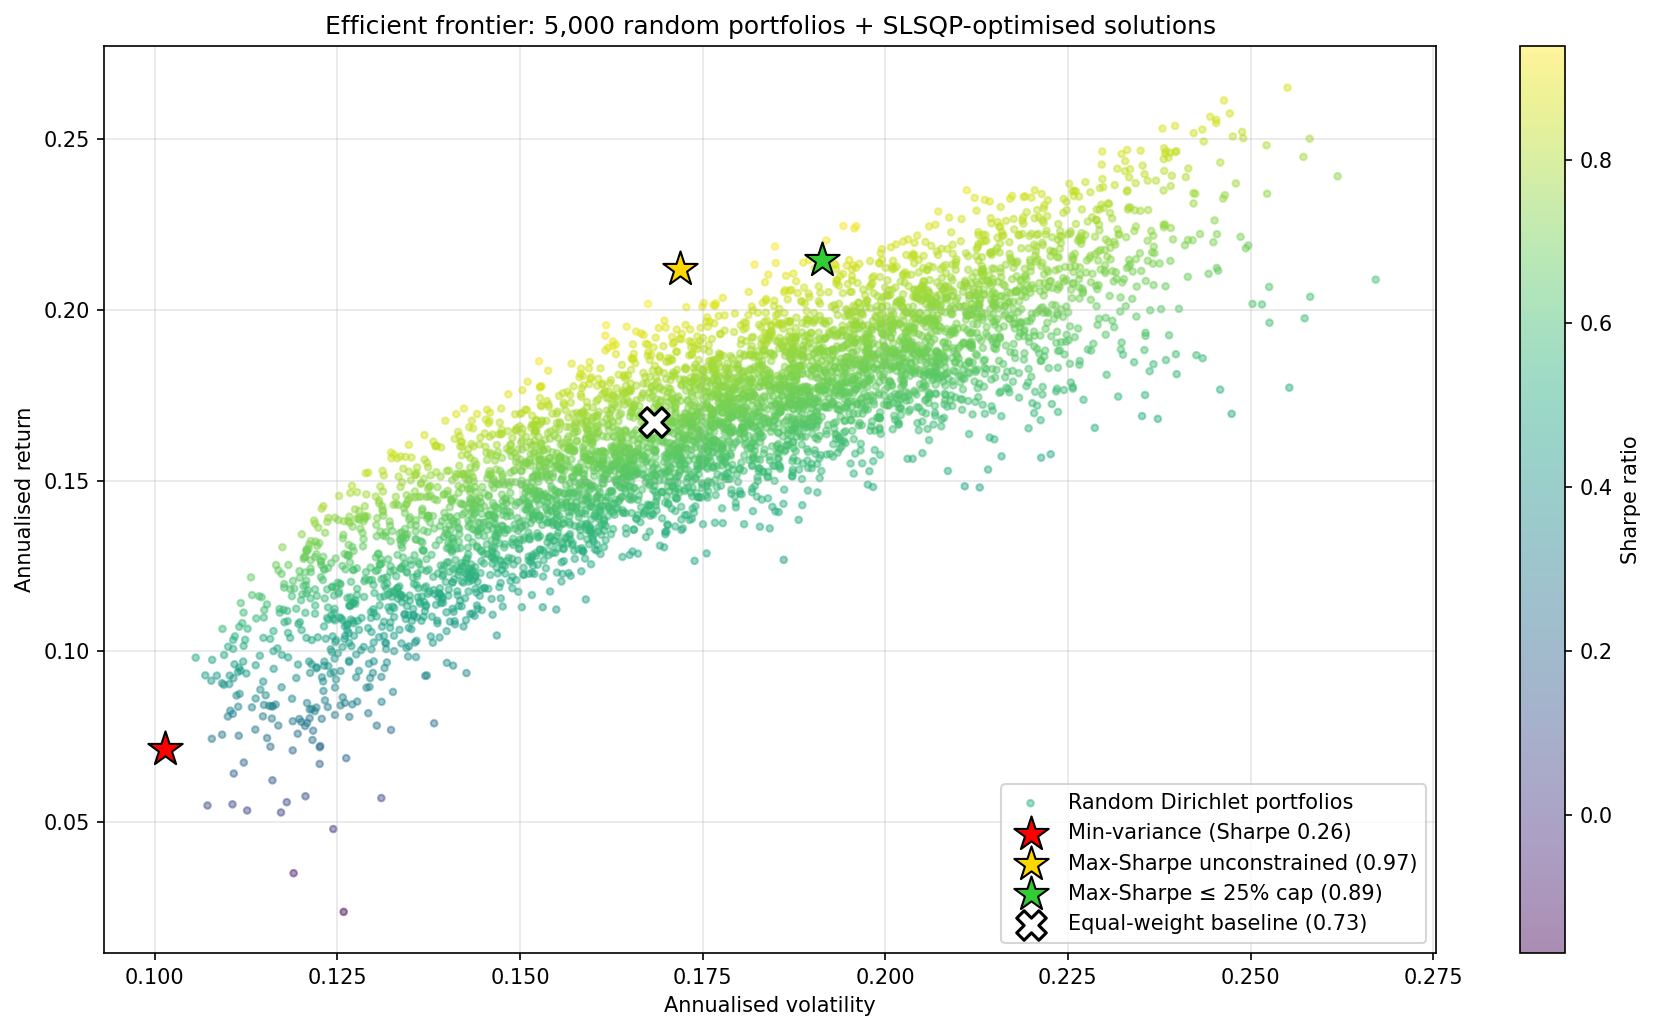
Three Value-at-Risk methodologies were implemented side by side: historical simulation (reading the loss straight from the 1st percentile of actual returns), parametric (assuming a normal distribution), and Monte Carlo (simulating thousands of correlated return paths via Cholesky decomposition). An efficient-frontier optimiser then swept thousands of weight combinations to map the risk/return trade-off.
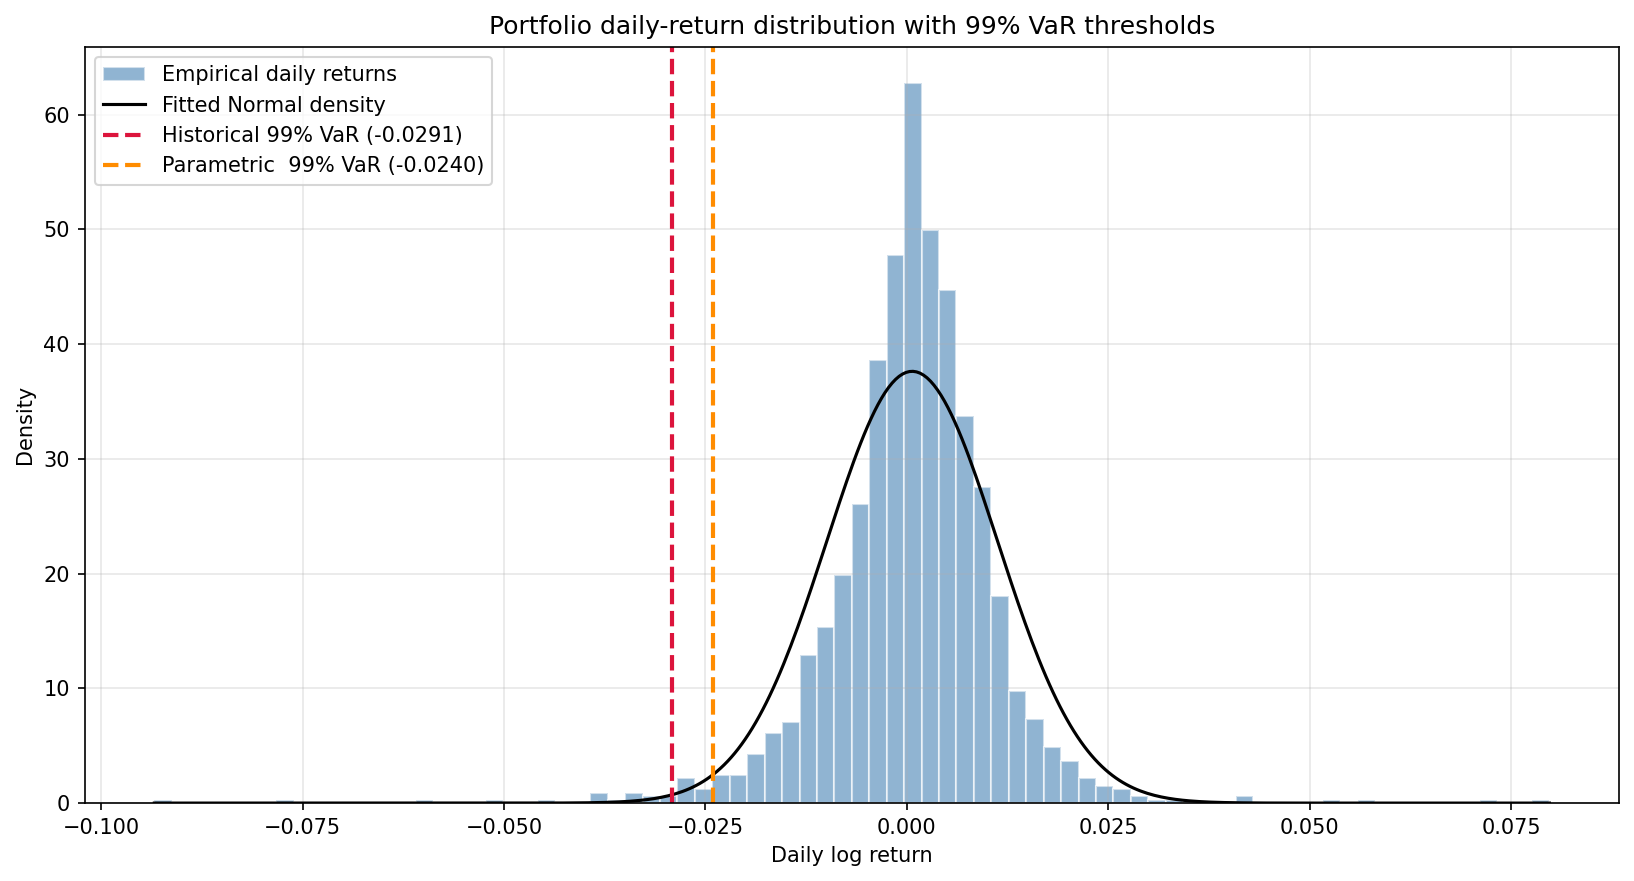
At 99% confidence, the historical 1-day VaR on a $1M portfolio is $29,146 — but the parametric model, trusting a normal distribution, put it roughly $5,100 lower.
That gap is the fat tail the normal curve can't see: the ‘safe’ assumption understates the worst day by about a sixth — precisely when the number matters most.
Trimming the technology concentration and adding uncorrelated exposure cut the 99% VaR by about 25% while lifting the Sharpe ratio from 0.73 to 0.89 — less downside and better risk-adjusted return at the same time. For an equity-heavy manager, adding uncorrelated diversifiers is the most efficient risk lever available, and parametric VaR should never be the only number on the page.